
83% of smart TV owners in the US connect their device to the internet, up from 70% in 2014, according to Parks Associates.
US consumers love streaming services more than traditional pay-TV

New US consumer data from Parks Associates finds the average NPS (net promoter score) for traditional pay-TV providers in 3Q 2018 is -19.
Research: UK viewers want voice control for smart TVs

New research from Parks Associates finds 24% of UK broadband households that own a smart speaker with personal assistant would like to control their smart TV via this device, nearly […]
33% of US cord cutters plan to use paid OTT services

Research from Parks Associates shows that consumer perception of a poor value proposition in pay TV remains the top trigger for changing, downgrading, or cancelling services.
91% of US OTT subscribers take Hulu, Amazon Prime Video, or Netflix

The top three OTT video services, Amazon Prime Video, Hulu, and Netflix, maintain significant market share, with 91% of OTT subscribers getting at least one of these services, according to […]
Parks: OTT video service churn steady at 18%

Parks Associates research finds the rate of cancellations for OTT video services among US broadband households has held steady over the past three years at approximately 18%.
20% of US consumers highly sensitive to viewing data collection

New video research from Parks Associates today reveals that a particular segment of consumers, representing approximately 20% of US broadband households, is highly sensitive to collection and use of information […]
40% of streaming media player owners use their device daily

Streaming media players are the most frequently used Internet-connected entertainment device, with 41% of owners using their players daily or almost daily.
30% of Netflix subs in premium service tier
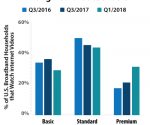
New Parks Associates OTT video research reports that 30% of Netflix subscribers are in the premium service tier, up from the 21% in late 2017.
Parks: Consumers watch more than two hours of alternative video

US broadband households watch an average of two hours of alternative content on a computer each week from sources including Facebook, SnapChat, YouTube, Vimeo, and Dailymotion.